


Further US attacks on Iran are sending traders scrambling into the oil market. The bidding is sending oil above US$90 ($128) per barrel in morning trade.
Historically, higher oil prices have threatened to increase inflation as those costs feed into the economy.
There is some interesting commentary from fund managers around this dynamic currently.
Chris Dickman, senior portfolio manager at Australian Ethical, is sceptical of the rally.
The Australian Financial Review quoted him last week as saying:
“Whilst there’s been a large fall in production actually being shipped out of the Gulf … you’ve actually seen some reasonable amount of uplift in other sources of oil coming onto the market,” said Dickman.
“Venezuela, Guyana, Nigeria, Norway: they’re all, to the extent that they can, going to produce more oil.”
Today, The Australian cites Citi’s chief US equity strategist, Scott Chronert:
“The chief US equity strategist at Citi considers the latest flare-up a short-term reversal because US President Donald Trump wants to end the conflict.
“‘WTI [West Texas Intermediate] crude at around $US80 is a critical line in the sand,’ Chronert says. ‘Above that level, the inflation and interest rate read-throughs that weighed on markets earlier this year start reasserting themselves — and the broadening trade loses its edge.’”
It’s possible oil continues climbing towards US$100 per barrel, depending on events in the Middle East.
The more pressing question for markets would be how long it stays there.
Right now traders and speculators are opening more oil futures contracts, according to energy analyst PK Verleger.
This explains more than half of the price rise over the past week. It’s less to do with a genuine shortage of crude and more to do with trader positioning.
Just as money flows into oil futures around the Middle East conflict, it could easily flow back out if the conflict settles down again. Only politics can determine that.
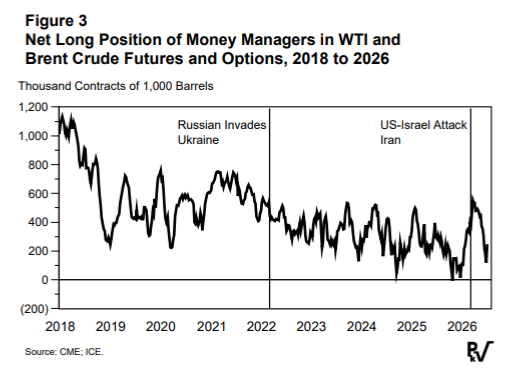
You can see on the chart above that the recent ‘net long’ position remains well below the peak in April.
There is also the chart below to consider, from Lion Selection Group.
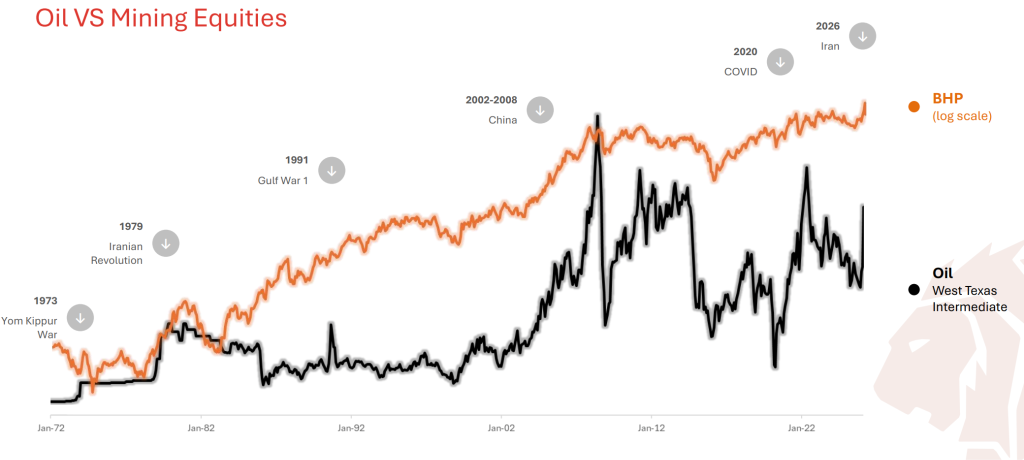
This chart demonstrates a very long-term comparison between the share price of BHP Group (ASX:BHP) and the oil price.
You can see that oil’s volatility since 2002 has driven it in big swings in either direction.
Overall, BHP continued to trend higher regardless. Markets adjust fairly quickly after an energy shock, then revert to the stronger trend that fundamentals keep driving.
We can also see that BHP’s share price rose alongside oil before the 2008 peak in crude.
A rising crude price isn’t always bearish for the economy or the markets. Sometimes it can signal strong demand from the economy.
Another macro strategist, Michael Howell, wrote in a recent update:
“The daily world GDP [gross domestic product] nowcast […] already points to a sharp acceleration in world economic momentum, despite continuing Gulf and oil tensions.”
A stronger economic environment means companies can pass on higher costs without sacrificing revenue growth.
For the resource sector in particular, the lack of major investment over the last 15 years also provides structural support.
Write to Callum Newman at Mining.com.au
Images: PK Verleger, Lion Selection Group & Unsplash